


As an engineer who has witnessed the ebb and flow of various development paradigms, I find the emergence of Server-Driven UI (SDUI) particularly intriguing. This approach, a departure from traditional client-centric UI architectures, offers a fascinating blend of flexibility and control, reshaping how we think about user interfaces in web and mobile applications.
Decoding Server-Driven UI
At its core, Server-Driven UI is about shifting the responsibility of UI rendering from the client to the server. Traditionally, UI logic is embedded within the client application, be it a web browser or a mobile app. Changes to the UI necessitate updates to the client-side code, often involving app store approvals and user-initiated updates through builds.
In the SDUI approach, the server sends UI configuration data to the client, which then renders the UI based on this data. This configuration can be in various formats like JSON or XML. The beauty of this approach lies in its centralization of UI logic, allowing for rapid updates and cross-platform consistency.
A Contrast with Traditional Architectures
Reflecting on traditional client-driven architectures, the difference with SDUI becomes evident. Client-driven UIs, while powerful for certain applications, often lead to redundancy and slower update cycles across platforms. SDUI, by centralizing UI logic, streamlines this process, ensuring that updates are instantaneous and consistent across all client platforms.
Ideal Use Cases for Server-Driven UI
From my experience, SDUI shines in scenarios where:
Rapid Iteration is Key: Applications requiring frequent UI updates or A/B testing benefit immensely from SDUI, as changes are made server-side without the need for client updates.
Consistency Across Platforms: For applications spanning web, iOS, and Android, SDUI ensures a uniform UI, as the server sends the same configuration to all clients.
Dynamic Feature Flags: SDUI is adept at handling applications that use feature flags to toggle features without new client-side deployments.
When to avoid Server-Driven UI
However, SDUI isn't a silver bullet. There are scenarios where it may not be the best fit:
Highly Interactive Applications: Applications with complex client-side interactions, like intensive animations or real-time gaming, might not fully benefit from SDUI.
Offline Functionality: If the application must function offline, SDUI can be limiting, as it relies on server communication for UI rendering.
Latency Concerns: Applications where response time is critical might face challenges with SDUI, as it depends on server response times for UI updates.
Let's go practical: Building a Server-Driven UI Dashboard
The Backend: Node.js Server
Laying the groundwork:
 mkdir SDUI
 cd SDUI
 mkdir BE
 cd BE
 npm init -y
 yarn add express cors
The package.json under BE should look like this:
 {
   "name": "BE",
   "version": "1.0.0",
   "description": "SDUI - BE",
   "main": "index.js",
   "scripts": {
     "dev": "node index.js --watch"
   },
   "keywords": [],
   "author": "",
   "license": "ISC",
   "dependencies": {
     "cors": "^2.8.5",
     "express": "^4.18.2"
   }
 }
Coding the Server:
In the BE folder create a new
index.jsfile and add the following code to it:const express = require('express'); const cors = require('cors'); const app = express(); const port = 3000; app.use(cors()); app.get('/dashboard', (req, res) => { res.json({ title: 'Dashboard', widgets: [ { type: 'infoCard', title: 'Sales', value: '$25,000', trend: 'up', description: 'Compared to last month', }, { type: 'chart', title: 'Visitors', chartType: 'line', data: { labels: ['Jan', 'Feb', 'Mar', 'Apr', 'May'], values: [200, 400, 300, 500, 400], }, }, { type: 'table', title: 'Latest Orders', columns: ['ID', 'Product', 'Customer', 'Total'], rows: [ [1001, 'iPhone 12', 'John Doe', '$799'], [1002, 'Samsung S21', 'Jane Smith', '$699'], // More rows... ], }, // Add more widget types as needed ], }); }); app.listen(port, () => { console.log(`Server listening at http://localhost:${port}`); });In the provided code snippet, we have a Node.js server application built using Express, a popular web application framework. The server is configured to listen on port 3000 and includes CORS (Cross-Origin Resource Sharing) support to allow requests from different domains, which is essential for modern web applications where the front end and backend are often hosted separately. The core functionality of this server is defined by a route (
/dashboard), which, upon receiving a GET request, responds with a JSON object. This JSON object is structured to represent a dashboard's UI configuration, containing a title and an array of various widgets (like info cards, charts, and tables). Each widget is an object with its own properties, defining its type, content, and other attributes. This setup exemplifies a Server-Driven UI approach, where the server dictates the UI elements and layout, and the client renders them accordingly.
The Frontend: React Application
Laying the groundwork:
 cd .. // back into the root - SDUI folder
 mkdir FE
 cd FE
 yarn create vite
On the frontend, we are using vite to initialize our React application and tailwindcss to style our components.
To setup the tailwindcss in your React Application, you can follow the official documentation here: https://tailwindcss.com/docs/guides/viteInstalling the necessary dependencies for the dashboard components:
yarn add chart.js react-chartjs-2These are the essential tools for our data visualization needs.
The package.json under FE should look like this:
 {
   "name": "FE",
   "private": true,
   "version": "0.0.0",
   "type": "module",
   "scripts": {
     "dev": "vite",
     "build": "vite build",
     "lint": "eslint . --ext js,jsx --report-unused-disable-directives --max-warnings 0",
     "preview": "vite preview"
   },
   "dependencies": {
     "autoprefixer": "^10.4.16",
     "chart.js": "^4.4.1",
     "postcss": "^8.4.32",
     "react": "^18.2.0",
     "react-chartjs-2": "^5.2.0",
     "react-dom": "^18.2.0",
     "tailwindcss": "^3.3.6"
   },
   "devDependencies": {
     "@types/react": "^18.2.43",
     "@types/react-dom": "^18.2.17",
     "@vitejs/plugin-react": "^4.2.1",
     "eslint": "^8.55.0",
     "eslint-plugin-react": "^7.33.2",
     "eslint-plugin-react-hooks": "^4.6.0",
     "eslint-plugin-react-refresh": "^0.4.5",
     "vite": "^5.0.8"
   }
 }
Rendering the UI:
In
src/App.js, we code the logic to fetch the UI configuration from our server and render it dynamically, bringing our dashboard to life.import { useEffect, useState } from 'react'; import InfoCard from './components/InfoCard'; import Chart from './components/Chart'; import Table from './components/Table'; function App() { const [dashboardConfig, setDashboardConfig] = useState(null); useEffect(() => { fetch('http://localhost:3000/dashboard') .then((response) => response.json()) .then((data) => setDashboardConfig(data)); }, []); const renderWidget = (widget) => { switch (widget.type) { case 'infoCard': return <InfoCard key={widget.title} {...widget} />; case 'chart': return <Chart key={widget.title} {...widget} />; case 'table': return <Table key={widget.title} {...widget} />; default: return null; } }; return ( <> {dashboardConfig ? ( <div className='max-w-5xl m-auto'> <h1 className='text-4xl m-auto mb-2 p-2'>{dashboardConfig?.title}</h1> <div className='widgets'> {dashboardConfig?.widgets.map(renderWidget)} </div> </div> ) : ( 'Loading...' )} </> ); } export default App;In
src/componentswe create three new widget components that ourApp.jsimports to support the configuration fetched from the backend// Chart.jsx import React from 'react'; import { Line } from 'react-chartjs-2'; import { Chart as ChartJS, CategoryScale, LinearScale, PointElement, LineElement, Title, Tooltip, Legend, } from 'chart.js'; ChartJS.register( CategoryScale, LinearScale, PointElement, LineElement, Title, Tooltip, Legend ); const Chart = ({ title, data }) => { const chartData = { labels: data.labels, datasets: [ { label: title, data: data.values, fill: false, backgroundColor: 'rgb(75, 192, 192)', borderColor: 'rgba(75, 192, 192, 0.2)', }, ], }; const options = { responsive: true, plugins: { legend: { position: 'top', }, title: { display: true, text: title, }, }, }; return ( <div className='p-4 border rounded shadow-lg m-2'> <Line data={chartData} options={options} /> </div> ); }; export default Chart;// InfoCard.jsx const InfoCard = ({ title, value, trend, description }) => { return ( <div className='p-4 border rounded shadow-lg m-2'> <h2 className='font-bold text-xl mb-2'>{title}</h2> <p className='text-2xl'>{value}</p> <p className={`text-sm ${ trend === 'up' ? 'text-green-500' : 'text-red-500' }`} > {description} </p> </div> ); }; export default InfoCard;// Table.jsx const Table = ({ title, columns, rows }) => { return ( <div className='p-4 border rounded shadow-lg m-2'> <h2 className='font-bold text-xl mb-2'>{title}</h2> <table className='min-w-full'> <thead> <tr> {columns.map((col, index) => ( <th key={index} className='px-4 py-2 border-b-2 border-gray-300 text-left text-sm font-semibold text-gray-600' > {col} </th> ))} </tr> </thead> <tbody> {rows.map((row, rowIndex) => ( <tr key={rowIndex}> {row.map((cell, cellIndex) => ( <td key={cellIndex} className='px-4 py-2 border-b border-gray-300 text-sm text-gray-700' > {cell} </td> ))} </tr> ))} </tbody> </table> </div> ); }; export default Table;Breathing Life into the Application:
We start both the server and the React application, anticipating the interactive dashboard taking shape in the browser.
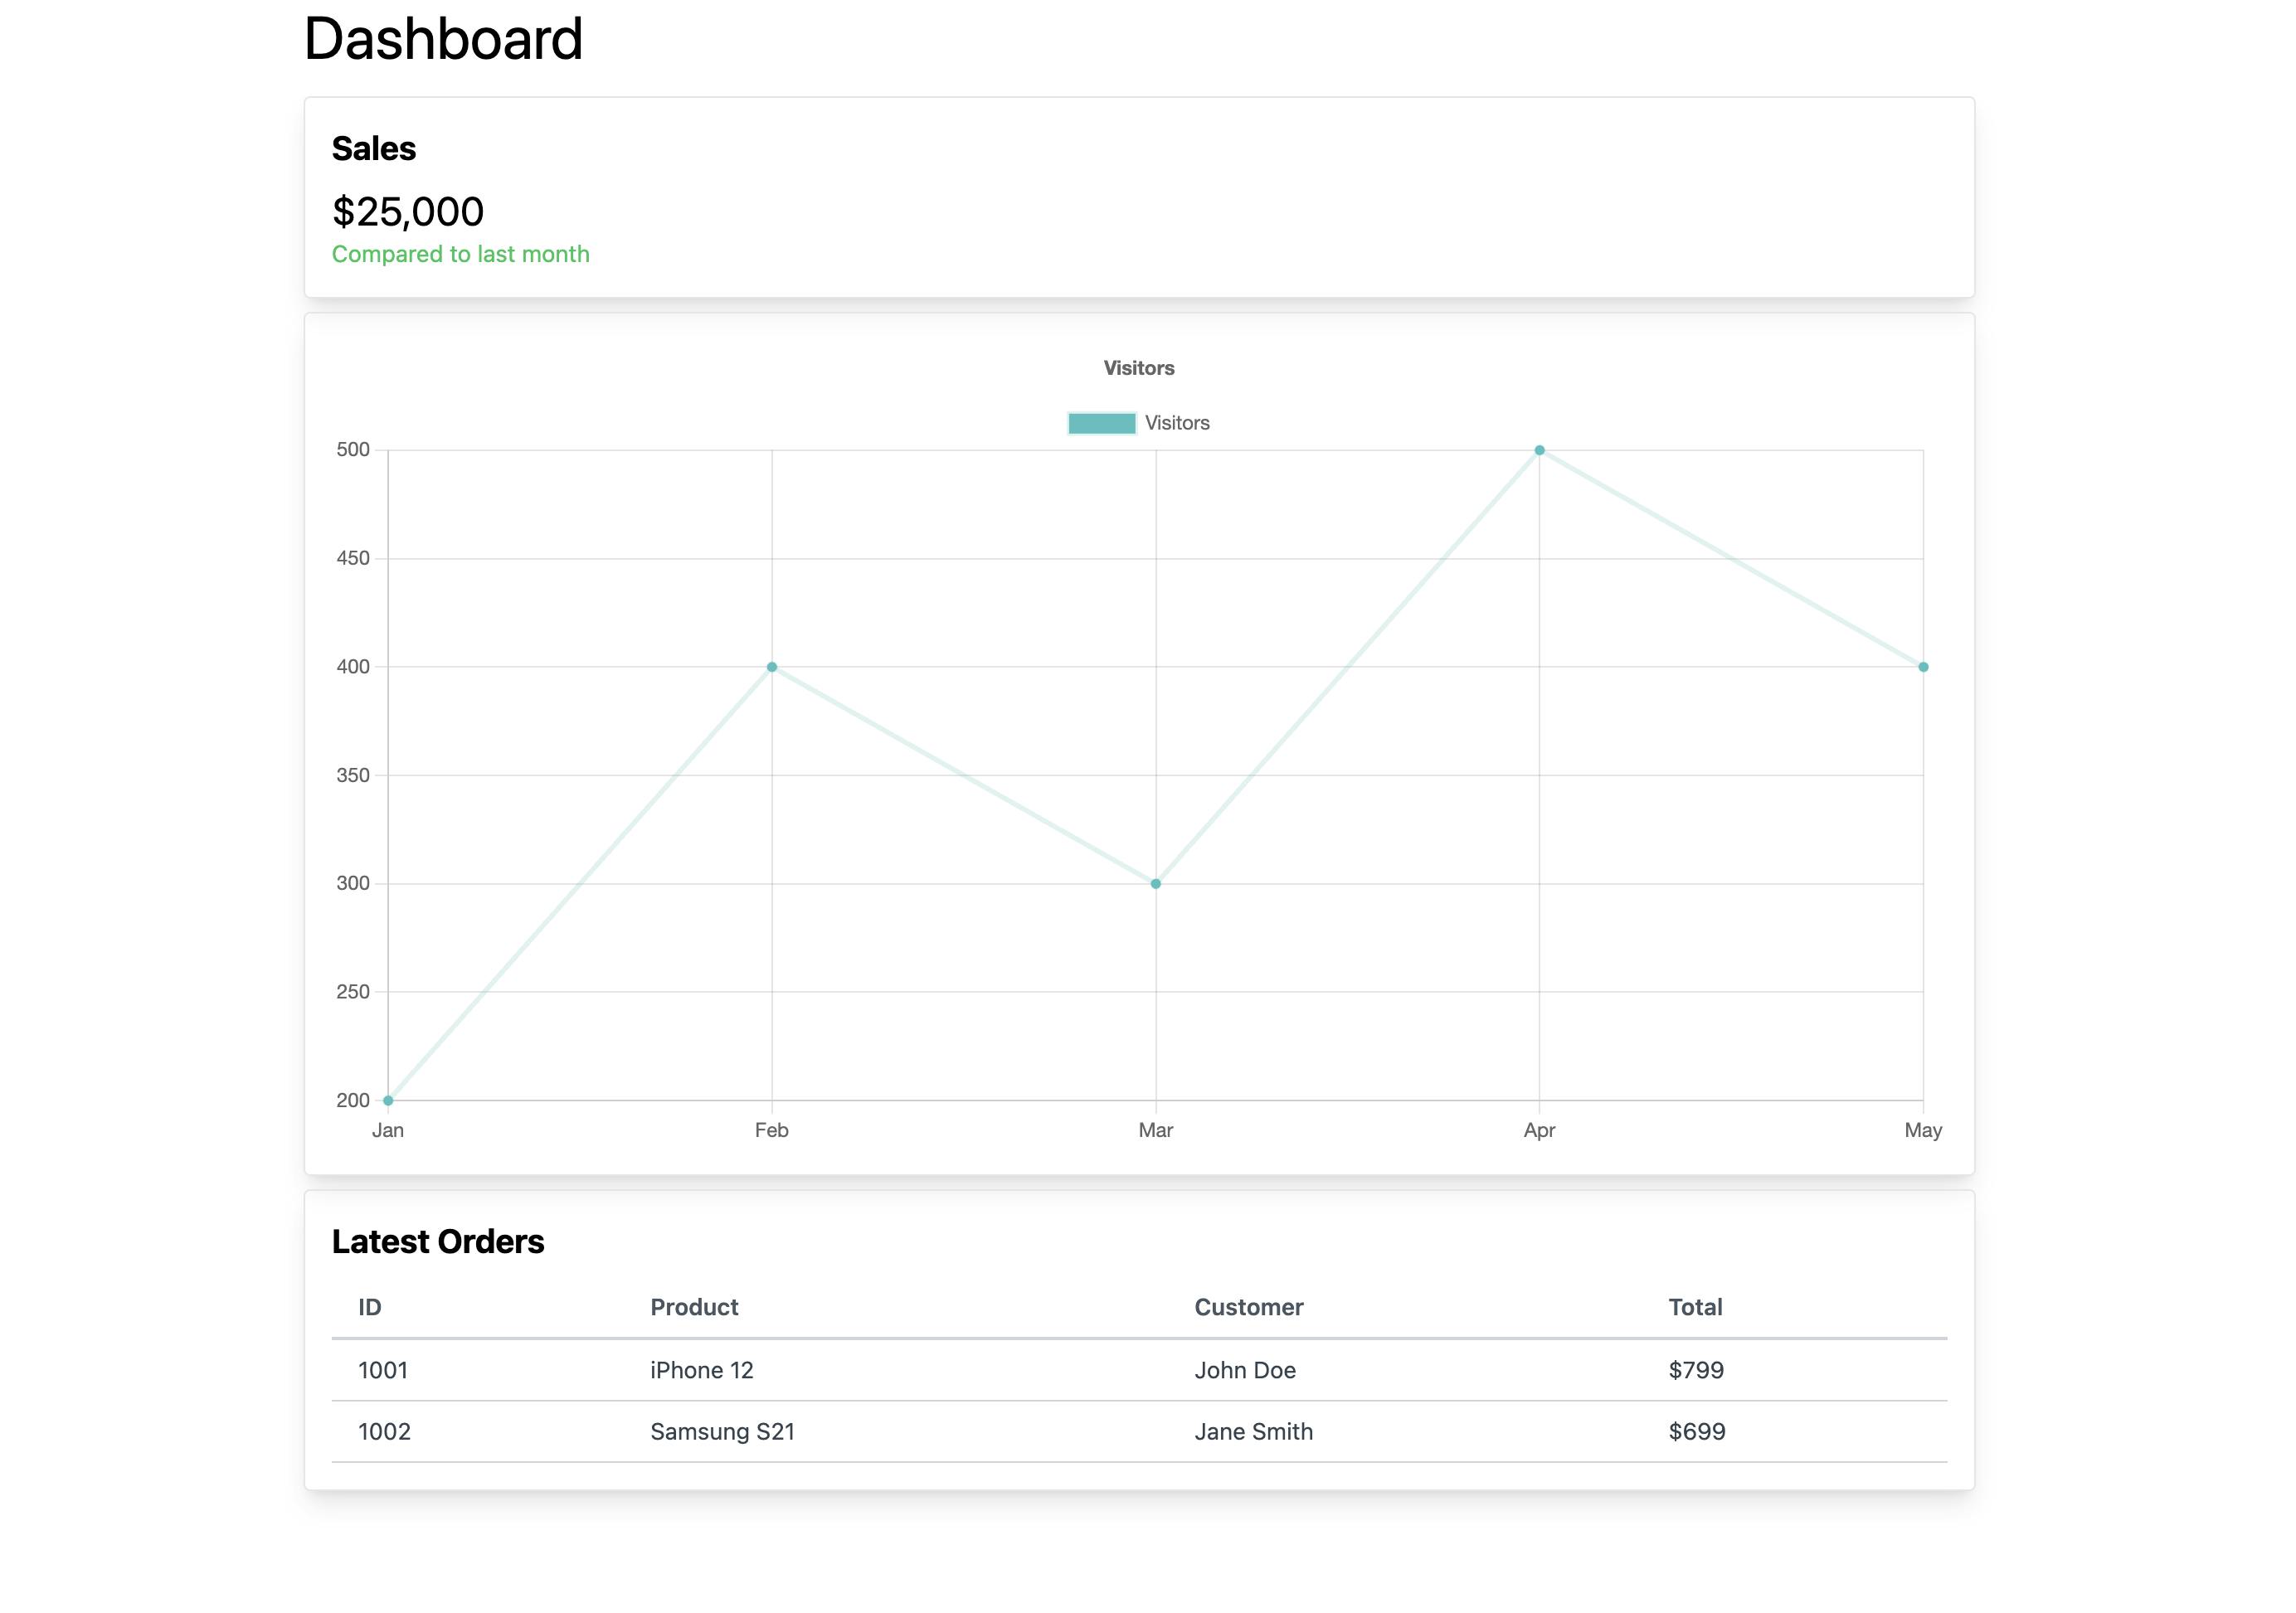
You can notice how the components are rendered in order of the widget list fetched from the backend. In case a widget needs to be removed, rearranged, or rendered, modifications to the widgets list in the server module will help us make the desired change without having to rebuild or deploy a new front-end build. (of course, a new component addition would first need the component to be coded on the front-end.)
Conclusion
In conclusion, our exploration of Server-Driven UI has illuminated its potential to transform UI management and updates. By shifting UI rendering responsibilities to the server, we unlock remarkable levels of control and adaptability. This approach facilitates swift and uniform UI updates across various platforms, enhancing efficiency in our development processes.
However, it's important to remember that the choice of architecture should align with the specific demands and limitations of each project. In software engineering, the most effective strategy often varies based on the unique context and needs of the project.
As we continue to evolve and adapt in the dynamic world of technology, Server-Driven UI stands as a powerful symbol of our ongoing quest for more streamlined, flexible, and user-centric approaches to application development.